As I lamented in a post exactly one year ago this week, it was harder than I expected to get historic energy usage information from our utility companies for pre/post-weatherization analysis of our consumption. Apparently, I should have been gathering information from our monthly bills for this project before we even knew we would need to be looking at weatherization contractors. Fortunately, Christian humored me and sat on the phone with our gas company’s customer service line to get the information I needed. And – I think – it was worth it.
But I digress… We had our attic insulated and air-sealed in May 2021, [1] and I was fortunate enough to bring with me a few years of experience from my previous job, where I managed contractors doing home health and energy efficiency upgrades. The attic weatherization followed a new roof, for which I did not have years of expertise to aid my decision. Fortunately, I had enough Life Cycle Analysis training in grad school that I was comfortable diving into the rabbit hole of our various material options. [2] But once all of that work was completed and a year had passed, I wanted to examine what kind of benefits we might be seeing – in our wallets and on the planet.
The Impact of Behavior
In last year’s electricity savings post, [3] I explained that our kilowatt-hour usage saw increases in both the summer months (from cooling the house with AC) and the winter months (from increased light and kitchen appliance use). Given those trends, our electricity use was actually the lowest in spring and fall, when there was more natural light, less Christmas baking, and less need for cooling the house. It turns out that our gas use trends are a lot simpler.
We primarily use gas for heating the house, since our stove and oven are electric. I have some professional colleagues who are minimizing their gas use and one who actually had the gas company come and shut off the gas line so he could be completely fossil free. We’re not there yet, but I am excited about the increasing number of options available to us, such as solar, that could help us decrease our reliance on fossil fuels. But – once again – while switching to renewables is great, the best thing you can do is simply use less in the first place, which is what we’ve tried to do by tightening up our house.
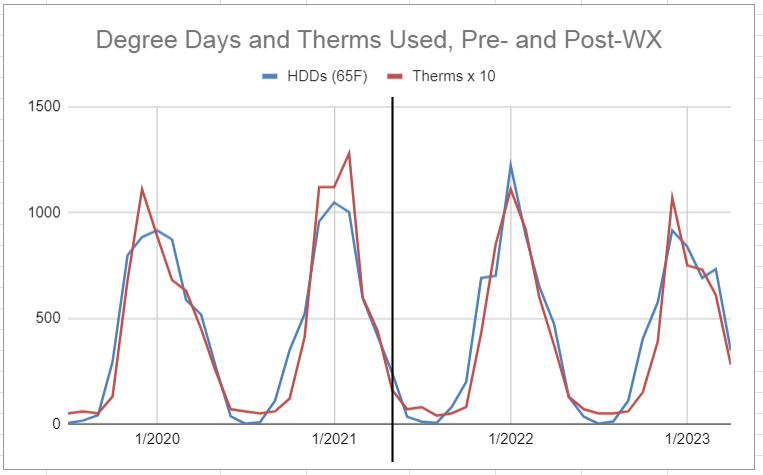
As expected, our monthly gas usage during the nearly four-year time period for which I had data, tracked very closely with the number of Heating Degree Days each month. Heating Degree Days indicate how many days had temperatures below a certain heating threshold and by how much. We keep our thermostat at 65F in the winter, so five days with outside temperatures at 64 degrees would equal five Heating Degree Days; one day at 60 degrees outside would also represent five Heating Degree Days. I explained Degree Days in more detail in the electricity savings post, but suffice it to say that they provide a method for creating a more apples-to-apples comparison of energy usage, independent of variations in the weather.
The Impact of Sample Sets
I was ultimately able to get almost two years of pre-weatherization data and two years of post-WX data from our gas utility and DegreeDays.Net, [4] which is great from the standpoint of examining seasonal trends over multiple years. (I had one year pre/post for the electricity analysis.) Unfortunately, there are always going to be complicating factors (namely humans) when it comes to examining potential energy savings as a result of efficiency measures in the home. Occupant behavior is a huge component, and there were some notable changes in our behavior during the time period in question. The most significant influence was the year-plus we spent in full COVID lockdown, [5] when we were home, using more gas – and that time period also aligned almost exactly with the last year pre-weatherization.
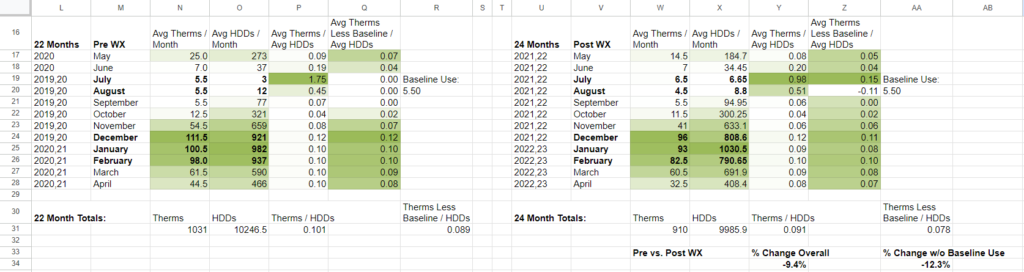
In looking at the data, I saw a distinct drop in therms (a unit of heat equal to 100,000 BTU) in February 2020, despite a large number of degree days. That drop was significant enough to impact the 2-year, Pre-WX, February average seen in Figure 2 (cell N26). That was an easy outlier to explain – we went to Japan for a month while I was in between jobs – but it still skews the data. On the other end, the first few months after our weatherization work was completed fell during summer 2021, a.k.a. “hot vax summer.” During those months, we were out and about much more, with a distinctly different social calendar than we had in the summer of 2020, which we spent in full lockdown. And since then, we have been traveling a few times a year, likely impacting what might otherwise be a straightforward process of data analysis.
Because the gas curves were so much more straightforward, I decided to look at total gas use across the years, without doing the more complex seasonal comparisons between summer, winter, and “shoulder months” that was necessary for the electricity analysis. In the simplest terms, we used less gas in the years after our May 2021 weatherization, but there was also less need for it, as the number of Heating Degree Days decreased during that time period as well (i.e. warmer weather). The question is which number had a more significant decrease? In the (almost) two years prior to weatherization, the value of Therms/HDDs was 0.101; in the two years after weatherization, that same calculation resulted in 0.091, demonstrating a 9.4% reduction in gas usage from pre- to post-WX.
Diving Deeper
Now because that was far too easy, I wanted to look at the savings most closely tied to the weatherization work. As I said, the vast majority of our gas is used for heating the house during cold weather, but we also use some for hot water when we wash laundry, dishes, and ourselves. Our dryer is also gas-powered (though I try to dry my clothes on the line as much as possible), and our grill is hooked up to the gas line, though we’ve been using it less of late (and I’m glad, now that I know what all is in that gas. [6]) But, ultimately, the number of showers and loads of dishes and laundry we do should be independent from the weather and the insulation status of our attic, so the next thing I sought to do was remove those.
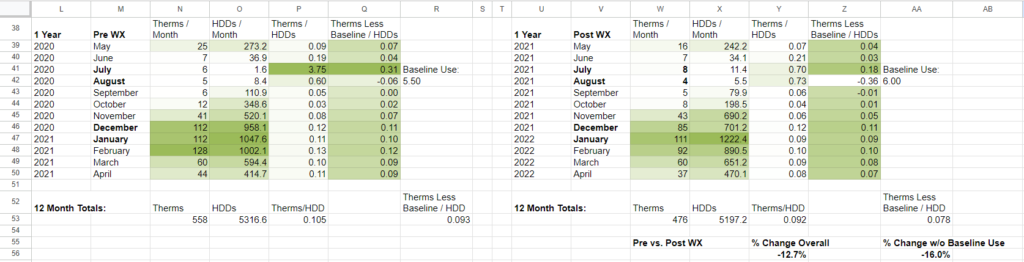
The months with the lowest number of Heating Degree Days and lowest number of Therms used were regularly July and August, averaging to about 5.5 Therms, which I used as our baseline. In the same large data set of nearly four years, subtracting 5.5 Therms from each month pre- and post-WX gets us to an average of 0.089 Therms/HDD and 0.078 Therms/HDD, respectively, resulting in a 12.3% gas use reduction (Fig. 2). I also looked at one year of data pre/post, since that was the same timeframe I examined for the electricity analysis.
Unsurprisingly, the savings in this smaller set (Fig. 3) were more extreme, as the weatherization work happened right as we were emerging from lockdown, and the following 12 months included no fewer than six weeks of travel away from home, when we would have been using less gas. Interestingly (and slightly embarrassingly), our baseline gas use actually increased in the summer of 2021, and I imagine that also has to do with our emergence from lockdown, as we had a good bit of laundry to catch up on after not leaving the house for fourteen months. Christian had also just gotten a new grill, so we were doing more grilling too – let’s go with that explanation.
~
One final thing I mentioned wanting to do in last year’s electricity savings post was to look at what kind of savings we’re seeing – not from a percentage standpoint, but from a dollar standpoint – so we can get a sense of the return on our investment of weatherization work. And we’ll take a look at that in next week’s post…
In the meantime, have you done any energy use analysis in your home? I’d love to hear about your process and your findings.
Thanks for reading!
Keep Reading About Energy Savings –>
[1] https://radicalmoderate.online/weatherization-update-electricity-savings-part-1/
[2] https://radicalmoderate.online/my-cabin-doesnt-leak-when-it-doesnt-rain-part-1/
[3] https://radicalmoderate.online/weatherization-update-electricity-savings-part-2/
[4] https://www.degreedays.net/
[5] https://radicalmoderate.online/414-days-of-solitude/
2 Comments
Tankless Water Heater – Radical Moderate · December 24, 2023 at 11:16 am
[…] the blog: we have a gas furnace, clothes dryer, hot water heater, and a gas hookup for our grill. [2] While the furnace represents the biggest component of our demand, my calculations show that hot […]
Ministry for the Future, Part 1 – Radical Moderate · January 18, 2026 at 5:02 pm
[…] and ElectricFrom my own energy analyses (done after getting our new roof and attic insulation, [5], [6] but before our tankless electric water heater [7]), I could speak to our average electricity […]