This post (probably final on this subject, at least for the foreseeable future) has been a long time in coming. It’s been about 2.5 years since the roofing and weatherization series I wrote in January 2021, whose timeline was dictated by a roof leak that necessitated speedy decisions about roofing materials and energy efficiency measures.[1] It’s been even longer than that (over 4 years) since my initial post on different types of roofing materials, at which point I was enthusiastic about the promise of a metal roof, and even more enthusiastic about the idea of solar tiles from Tesla.[2]
As this post goes live, it will be seven years to the day that I moved my stuff from my apartment into Christian’s house… and in that time, I’ve made some progress on home and garden goals, but certainly less than I intended. Looking at that Facebook memory and these past blog posts, I am once again reminded that home projects are often measured on the order of years, sometimes decades.
Building Science, and Energy Efficiency, and Utility Companies, oh my!
And evidently some blog projects are measured on the order of years as well, if the chronicling of home projects is involved, as is the case here. What began with some roof damage in the spring of 2019, resulted in some cursory research into roofing options, followed by in-depth evaluation of claims made by different product manufacturers when we were actually forced to make a decision in January 2021. Of course I enjoyed reading research that had been done into energy efficiency benefits of different types of roofing materials (and evaluating whether product claims were actually valid), as well as running my own life cycle analyses on the amount of energy it takes to produce and recycle (if possible) those materials, and also examining the implications of cost in what might be the most substantial investment we were going to make in this house while we live here.
Ultimately we went with asphalt shingles for the roof because it took less energy to produce them vs. metal shingles, even though metal is recyclable, and asphalt shingles are generally not (not around here anyway – I looked into our options.) We also decided to take the cost savings from opting out of metal and put it toward weatherizing the attic, knowing that air sealing and insulating underneath the new roof would save us money in the long run on our gas and electric bills and also be better for the environment because it would help us use less. At the time, I could only calculate potential savings using estimates of what our weatherization company said they could save us and data from the home weatherization program I ran at my last job.
Now that we’re more than two years past our weatherization work (and Christian has patiently waited on hold with customer service for me to get historic gas usage data), I can now take a look and see not only what we’ve saved in energy usage, but I can also make some estimates about cost savings to provide a rough idea of when we’ll see a return on our investment. Keeping in mind that these numbers are still estimates based on two years of electricity and four years of gas usage, with even more limited access to what we actually paid, and nothing but conjecture about how future weather will impact our usage, I was still excited to go through the exercise.
Color-Coded Spreadsheets and Data Analysis: These are a Few of My Favorite Things
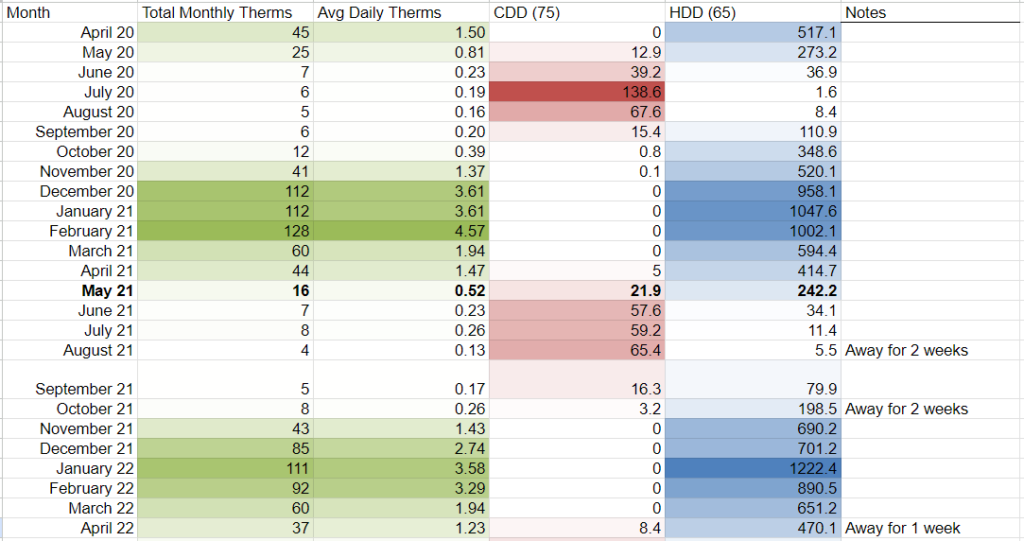
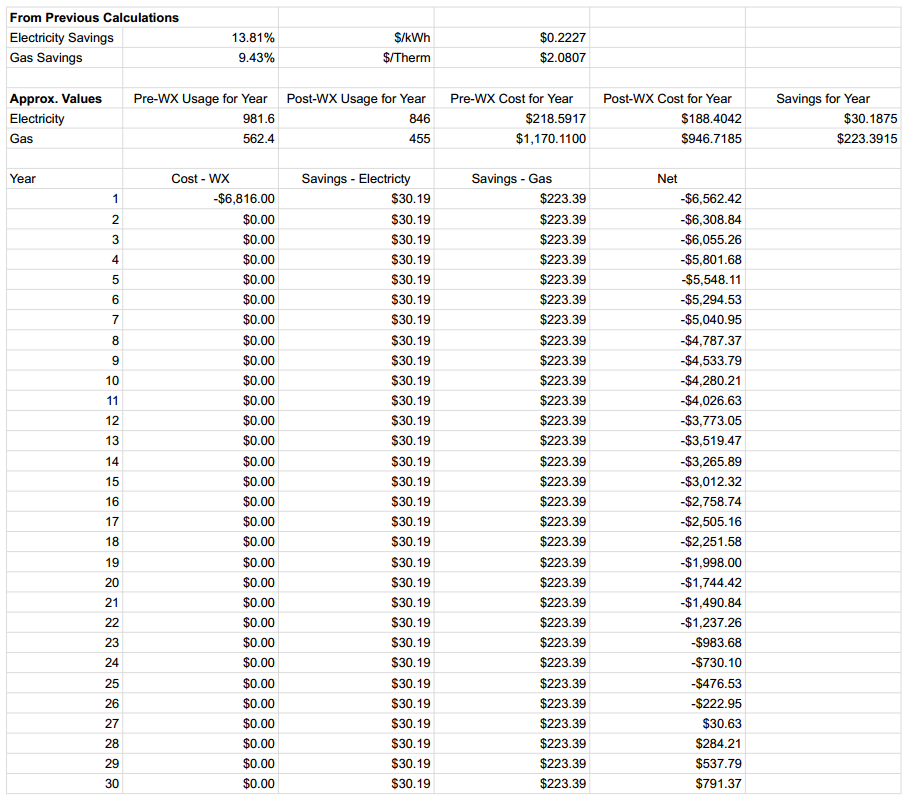
Keeping things as simple as possible, I began by looking at the savings calculations for electricity and gas that I had described in previous posts. Gas was much simpler, as our use tracks very closely with the amount we use to heat the house in cold weather. Electricity was a little more complicated, as much of it goes to cooling the house in hot weather, but we also use more of it in the winter, too. In the end, I stuck to the simplest calculations of electricity use as a function of cooling degree days, as I had with gas use as a function of heating degree days. Total pre-weatherization use divided by total pre-weatherization degree days, compared with total post-weatherization use divided by total post-weatherization degree days resulted in a 13.81% reduction in electricity use from pre to post, and a 9.43% reduction in gas use.
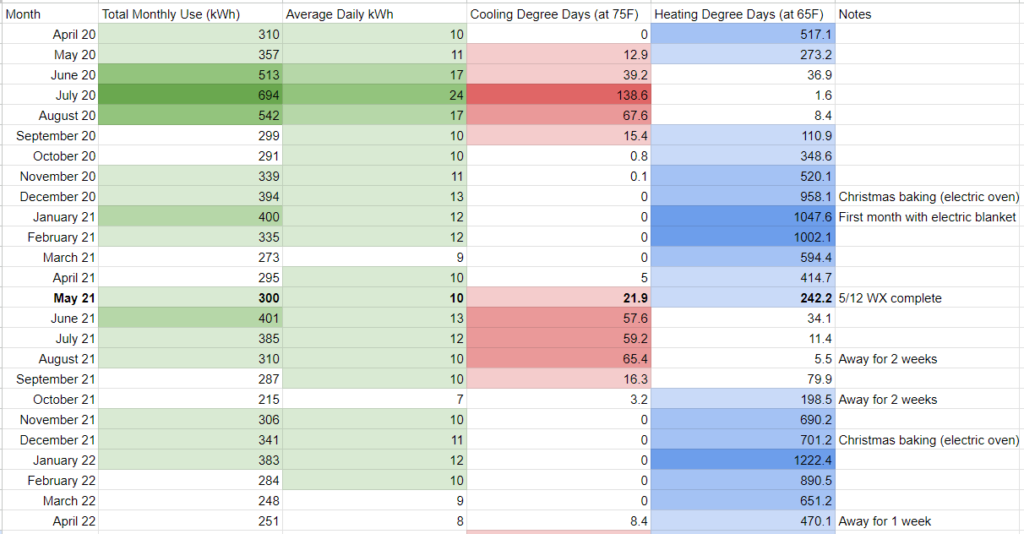
I chose not to isolate the energy saved from heating/cooling alone because I wanted a sense of how much we would have been paying in total with and without weatherization. As I mentioned in the previous posts where I described these calculations, there are things such as laundry, dishes, light, etc. that require energy, regardless of the temperature, and are thus unrelated to how much we’re saving through weatherization. Leaving those out would overstate the savings (as I saw in some promotional materials which were clearly calculated based solely on the energy used to heat or cool a space, not total energy used within a building); leaving them in would result in a much more conservative estimate, which is what I’m looking for here.
If our usage information was limited, our spending information was even more so. I only had monthly billing totals from post-weatherization bills, meaning that I had to extrapolate based on the savings and assume that prices prior to May 2021 were in the same ballpark as after. We know that energy prices fluctuate, so these estimates could be very far off. From the standpoint of holding prices steady, however, we can at least make some reasonable assumptions.
Gas and electric prices fluctuate throughout the year, so I took overall averages from the timeframe available (total spending divided by total use) to come up with an average of $0.2227 per kilowatt-hour of electricity and $2.0807 per therm of gas. Then, using the percent savings amounts, I took our post-weatherization spending ($188.40 and $946.72, respectively) to calculate pre-weatherization spending ($218.59 and $1170.11, respectively). From there I subtracted post-WX spending from pre-WX spending to arrive at $30.19 savings for electricity and $223.39 savings for gas. (Note, I couldn’t just compare total spending, even if I had those numbers available, because the weather was different from year to year, necessitating different amounts of weather-dependent heating and cooling).
“Prognosticator of Prognosticators” is Not My Job Title
Projecting forward, as with looking back, I don’t know what costs are going to do (though I can assume they will continue to rise), nor do I know what temperatures are going to do (though I can assume they will continue to become more extreme). Holding everything constant with our total calculated savings of $253.58 per year is a conservative estimate, but one I’m comfortable using for the purposes of this back-of-the-napkin calculation. The original question I had was how long will it take for our weatherization work to pay for itself? The total cost of insulation and air sealing in our attic was $6,816. Assuming an annual energy savings of $253.58, that work will have paid for itself in 27 years, roughly half the guaranteed life of the roof.
One complicating factor I haven’t mentioned (as if inflation, fluctuating energy prices, and fluctuating global temperatures weren’t complicated enough already) is the increased costs of choosing a reputable third-party electricity supplier.[3] We switched our electricity supplier in April 2022 when Vladimir Putin gave me the push I needed out of analysis paralysis to make a choice so that we were no longer supporting demand for electricity produced from fossil fuels.[4] That switch made our electricity bills more expensive, so I left those three months out of the calculation, since they were skewing the post-WX cost calculations. What that means is that our savings calculations are based on Duquesne Light rates, not third-party rates.
Unfortunately, that third-party supplier closed up shop, so we’re back to Duquesne Light, and I need to make another decision about where we want to buy our electricity. For now, though, that’s where we landed with our roofing/weatherization/energy/cost scenario, several years in the making. I’d love to hear if you’ve done something like this analysis at your home or if you would have done something differently in my place. Let me know below.
And thanks for reading!
[1] https://radicalmoderate.online/my-cabin-doesnt-leak-when-it-doesnt-rain-part-1/
[2] https://radicalmoderate.online/sustainable-roofing-materials/
[3] https://radicalmoderate.online/third-party-electricity-suppliers-part-1/
[4] https://radicalmoderate.online/renewable-energy-and-energy-independence-part-1/
1 Comment
Tankless Water Heater – Radical Moderate · January 21, 2024 at 4:09 pm
[…] electricity to be a little over 3 times more expensive during the last two years at our house. [10] The calculations I did for this exercise used rates from our local providers’ websites, […]