Part 2 – Energy Savings Calculations
When comparing energy usage before and after weatherization, it is important to consider what factors other than the weatherization work itself might have created fluctuations in your energy use, notably behavior changes and weather. For instance, if we were away for half of August (which we were in 2021), our energy use would drop; if it was a cooler summer to begin with (which it was in 2021), we wouldn’t need the air conditioning as much to begin with. What that means is that even if we hadn’t had any weatherization work completed in the spring of 2021 (or if the work was ineffective), we might see a false reduction in energy usage for other reasons. To make something more akin to an apples-to-apples comparison – at least from a weather perspective – we need to look at information called Degree Days.
Degree Day Data
Degree Days are a metric used to help us understand how much heating or cooling was necessary during a given period of time by first identifying the temperature above which the air conditioning kicks on (or the temperature below which the heating kicks on) and then identifying both how many days were above (or below) that value and by how much. The hotter the time period, the more cooling degree days there are. (The colder the time period, the more heating degree days there are.) These numbers also vary depending on where you keep your thermostat: you’ll be using more energy if you set your thermostat to 72 in the summer instead of 75; more energy in the winter if you set your thermostat to 68 instead of 65.
Degree Day Calculation Example:
We keep our thermostat at 75 degrees in the summer, so, for example, if there were 5 days in a month where the temperature was 76 and all the other days were below 75, that would mean 5 days at a difference of 1 degree: 5 x 1 = 5 cooling degree days in that month; if there were 5 days in a month where the temperature was 85 and all the other days were below 75, that would mean 5 days at a difference of 10 degrees: 5 x 10 = 50 cooling degree days.
Looking at degree days helps to put raw usage numbers in the context of how much energy was actually needed to condition the space. To do that, you can follow a very simple equation: divide the energy used during the time period in question by the number of degree days during that time period. You will then be able to compare energy used per degree day, which provides a far better comparison for pre- and post-weatherization than just looking at raw usage numbers. Degree Day information is available online, going back 36 months for multiple locations throughout the US;[1] energy usage is… theoretically available from your utility companies.
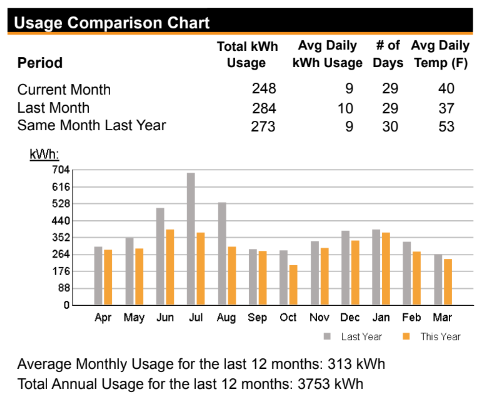
Electricity Use Data
Back when I ran a weatherization program, I had agreements with the local gas and electric utilities that allowed me to pull usage information for homes involved in the program – with the owners’ permission, of course. I foolishly thought I would be able to access our own usage information just as easily. Our electricity company’s customer portal allowed us to pull only the last 12 months of bills, which was not what I needed for a two-year comparison. Fortunately each bill included a year-over-year comparison with the same month in the prior year. That gave me two years’ worth of data for electric usage, which Christian pulled for me in May of this year, about one year after our weatherization work was completed. (You’re off the hook for now, Duquesne Light!) Unfortunately, our gas company is even less helpful, so for the time being, my savings analysis will be limited to electricity savings, unless we can get customer service at the gas company to help us out.
One year of pre-weatherization data and one year post weatherization data is the absolute minimum amount of information I would like to be using for a rudimentary analysis, but it’s enough for the purposes of this blog. As I mentioned above, understanding behavior is important as well: we use electricity to cool the house with air conditioning in the summer and gas to heat the house in the winter. Our stovetop and oven are electric and get a lot of use during the holidays, particularly for cookie baking at Christmas; we use lights (including Christmas lights) a lot more in the dark winter months; and I have an electric blanket I use when I’m cold (Christian will sometimes turn it on for the kitties if they ask).
Overall, our electricity usage should vary most significantly as a function of how hot it gets in the summer and less so as a function of temperature in the winter. Given that, I expected to see pre-weatherization electricity values that were highest in the summer and lowest in the “shoulder months” (spring and fall), with medium electricity use in the winter because of increased lighting and baking. All of that would point to a likely reduction in summer electricity usage after weatherization work was completed, with the rest of the year staying about the same.
Results
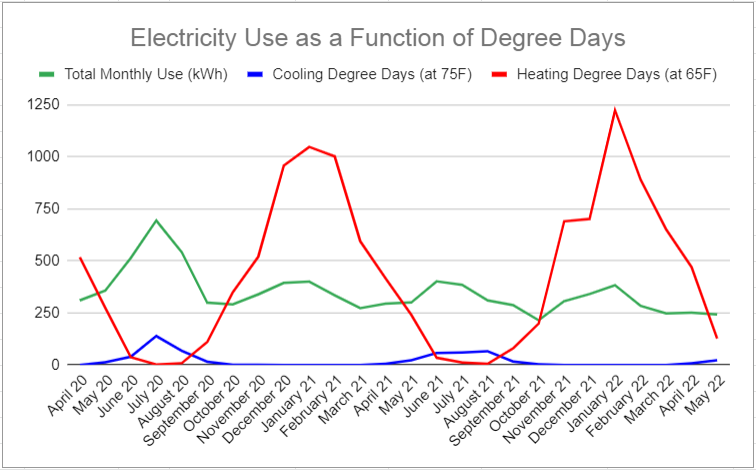
To get a better sense of our heating and cooling needs over the period in question, I created a chart (Fig. 1) showing the heating degree days, the cooling degree days, and our total kilowatt-hour usage. As expected, electricity use increased both in the summer months and the winter months, with the least amount of electricity used in the shoulder months. Again, since our heating is electric, the biggest demand pre-weatherization arguably came from cooling costs in the summer, with a dramatic reduction from summer 2020 to summer 2021.
I wanted to get an idea of how dramatic a change that actually was, so I divided up the data into the heating months (November, December, January, February – all above 300 kWh/month pre-weatherization), the cooling months (May, June, July, August – also all above 300 kWh/month pre-weatherization), and the shoulder months (September, October, March, April – all below 300 kWh/month pre-weatherization).
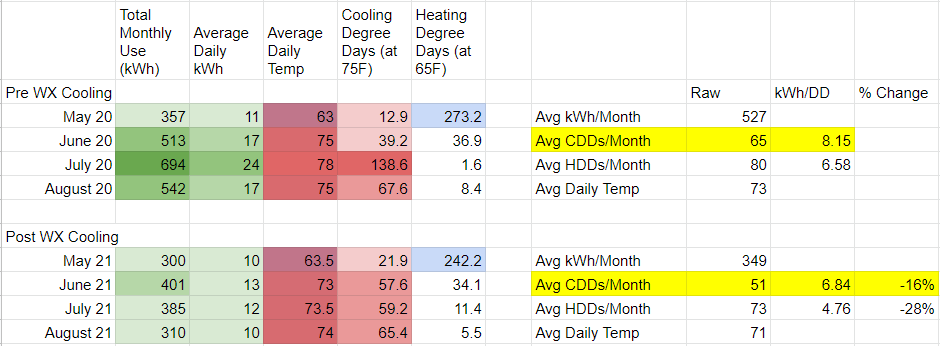
Rudimentary analysis of kilowatt-hours used per number of degree days within a given month. There was a notable reduction from one summer to the next, roughly in alignment with the improvements I saw in the program I used to run.
Certainly, I could just look at total kWh used in each summer, divided by total cooling degree days, which is where I started – and here is what I found (Fig. 2): given overall electricity usage and degree days during the summer months, we saw a reduction from 8.15 kWh/Cooling Degree Day in 2020 to 6.84 kWh/CDD in 2021, which is a 16% drop.
But I still wanted a better sense of what these numbers meant in the context of our cooling costs. I knew that a large portion of our usage was tied to electricity we would be using anyway (dishwasher, washing machine, stovetop, oven, lights, computers, etc.), so I pulled the totals for electricity usage during the shoulder months out of the totals for the summer (and winter – just for kicks) to get a better view into seasonal usage.
Shoulder month electricity usage was still slightly higher pre-weatherization than post-, and it appears that a lot of that is related to energy reductions on cooling degree days. But I was fine with that because subtracting a smaller value from the post-weatherization summer and winter months made my calculations more conservative. And here’s what I found:
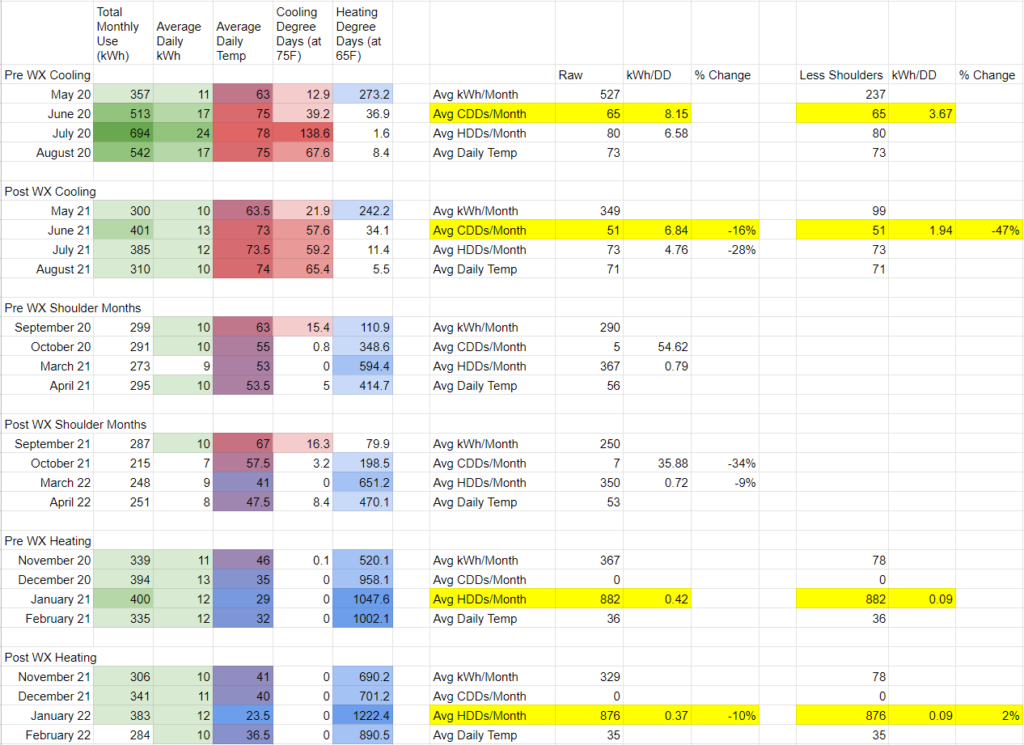
The most compelling result of this process is the conclusion that I’m a sucker for a color-coded spreadsheet. This chart shows heating, cooling, and shoulder months, and how much our electricity use fluctuated as a result of heating and cooling needs.
In the winter months, just looking at the basic calculations from overall usage, we saw a reduction from 0.42 kWh/Heating Degree Day to 0.37 kWh/HDD, pre- and post-weatherization, respectively. However, once removing the shoulder month usage (Fig. 3), we saw the values shift to 0.09 kWh/HDD pre-weatherization and 0.09 kWh/HDD post-weatherization. What that means is that while we were probably more efficient with other aspects of our lives, the weatherization work had very little effect on our electricity use in the winter: exactly what I had suspected.
Summer numbers became much more dramatic with the shoulder month values removed. While we started off with an overall drop of 16%, taking out the other daily electricity usage and focusing solely on electricity used for our air conditioning gave us a reduction from 3.67 kWh/CDD to 1.94 kWh/CDD – a drop of almost 50%!
If you’re still with me, thanks for sticking it out through all of the calculations. Ultimately, I’m very pleased with just how much energy savings we’re seeing as a result of our weatherization work. It’s also been fun for me to crunch numbers like these again. If I can ever get a hold of our heating data, I would love to do some return on investment calculations to see how quickly we’ll be making our money back on the air sealing and insulation work.
~
Have you done any calculations like this for your home? How did you look at the numbers? I’d love to hear about it below.
Thanks for reading!
[1] https://www.degreedays.net/
2 Comments
How Much is Enough? – Radical Moderate · June 2, 2024 at 2:25 pm
[…] feel better knowing that we’re using less electricity than we were before weatherizing our attic [10] and that whatever fossil-based electricity we’re using is being offset with renewable energy […]
Ministry for the Future, Part 1 – Radical Moderate · January 18, 2026 at 5:03 pm
[…] ElectricFrom my own energy analyses (done after getting our new roof and attic insulation, [5], [6] but before our tankless electric water heater [7]), I could speak to our average electricity and […]