Part 3 – The Aftermath
A few weeks before we left for Japan this past January, I told a group of friends that Christian and I would be touring the Fukushima Exclusion Zone. One person was appalled and asked why we would want to expose ourselves to that kind of radiation. I explained that “that kind of radiation” is less than what we would absorb on the flight to Tokyo, and that it was perfectly safe to travel to Fukushima. In fact, the tour organizers at Japan Wonder Travel[1] were counting on bringing in a group of influencers (I’m an influencer, apparently?) who could share their experiences and fight against the volume of misinformation about the region that has persisted in the media for the past nine years.
The Earthquake and Tsunami
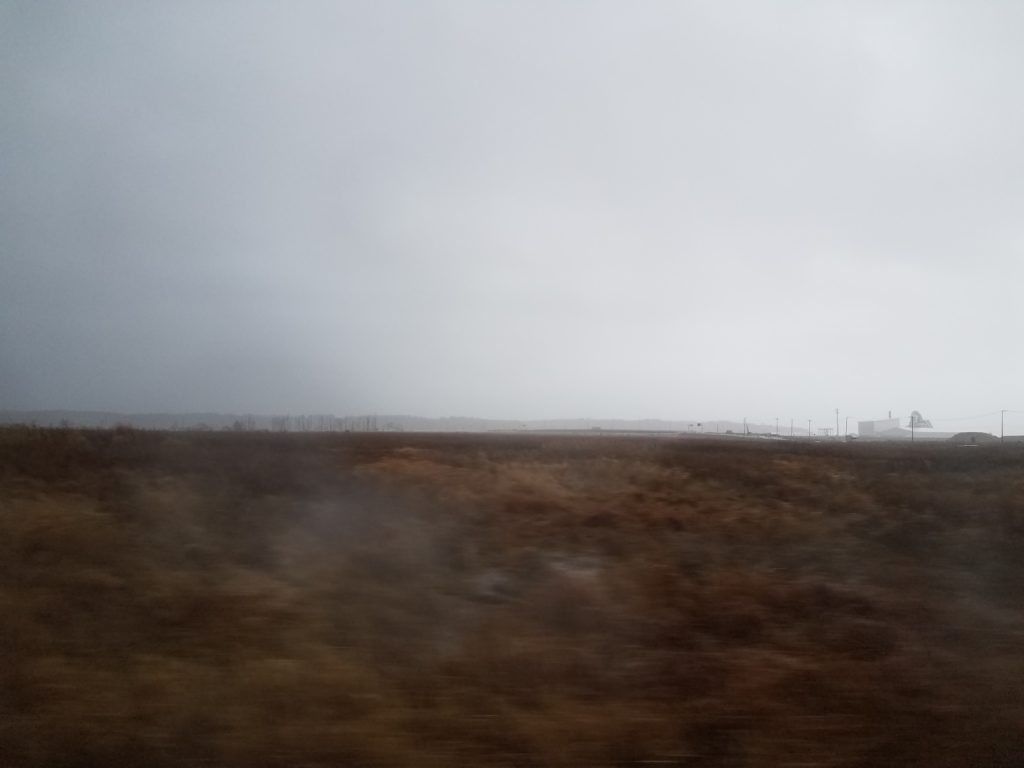
While our very focused experience on this trip consisted of interviews with people who lived within 20km of Fukushima Daiichi and whose lives were directly affected by the evacuation and subsequent contamination near the plant, I would not be doing justice to the people across Japan whose lives were destroyed directly by the earthquake and tsunami if I did not point out that the nuclear disaster made up only a small portion of the devastation experienced in March 2011.
There were victims of the tsunami who were, in fact, concerned that their needs had almost been forgotten in the media storm around Fukushima. A British expat spearheaded an online initiative called “Quakebook,” which was later published under the name 2:46 – Aftershocks: Stories from the Japan Earthquake.[2] This effort crowdsourced individual experiences via social media (mostly tweets and photos) in the hours and days following the disaster.[3] The Tokyo resident who negotiated the publishing deal with Amazon specifically mentioned that the events at Fukushima Daiichi were overshadowing the broader human tragedy resulting from the tsunami.[4]
Many people don’t realize is how devastating the earthquake and tsunami were to Japan as a whole. The numbers alone are staggering:
- It was the fourth most powerful earthquake on record since 1900 (since modern record keeping began).
- It moved Japan 8 ft to the east.
- It affected the tilt of Earth’s axis and speed of its rotation.
As for the wave:
- The tsunami was as high as 40 m in some places when it reached shore and traveled as far as 6 miles inland.
- I mentioned last week that residents of Fukushima prefecture had almost an hour of warning, but residents of Sendai (population 1M+) had less than ten minutes.
The total impact on lives – across residents of twenty prefectures – includes 15,899 deaths, 6,157 injuries, 2,529 who are still missing, and 228,863 evacuees who are still in temporary or permanent relocation.[5]
Often these impact numbers are mentioned as resulting from the disaster as a whole (earthquake, tsunami, and nuclear meltdown), making it easy to assume that a significant portion of deaths resulted from the accident at Daiichi, when in fact there were no directly-associated fatalities. What has happened as a result of the nuclear disaster is tragic, but again, clear information on this subject seems to have eluded mainstream media for the past nine years.
I in no way intend to minimize the fear and suffering of the 160,000 evacuees from the Fukushima coast, but there is no doubt that media speculation and misinformation about what was happening at Fukushima Daiichi took center stage immediately and indefinitely, to the detriment of other relief efforts.
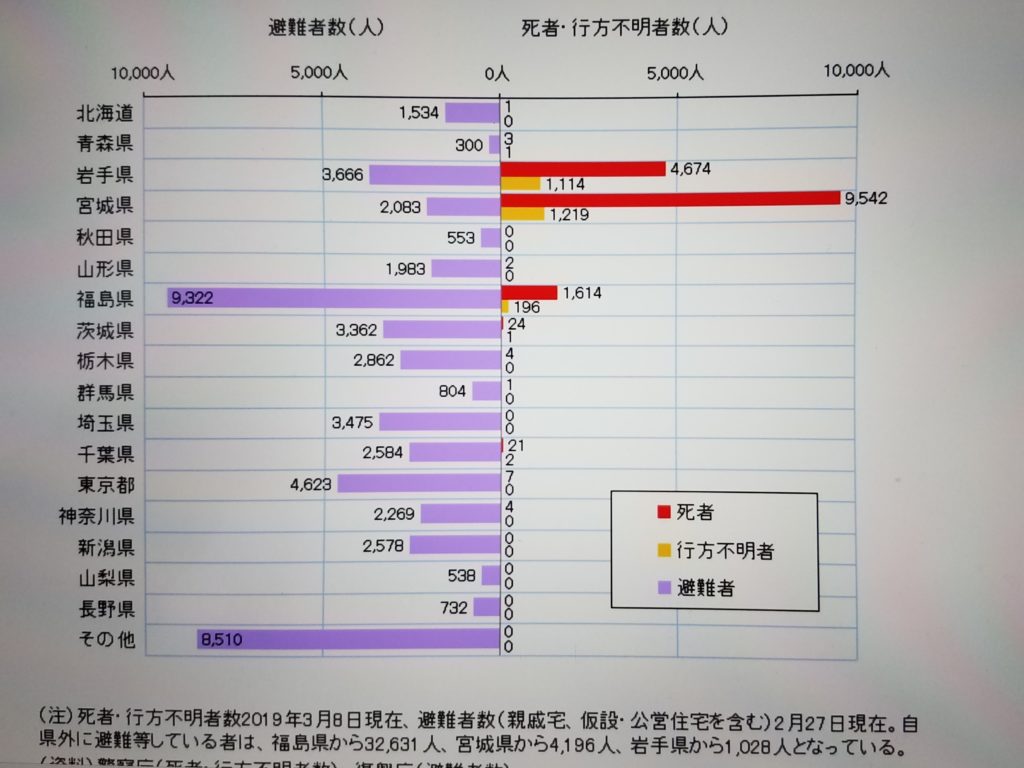
Red shows the number of deaths, which were highest in Miyagi (where Sendai is located), followed by Iwate (to the north), and Fukushima (to the south).
Yellow shows missing persons, which tracks along with the death count.
Evacuees who have still not returned home are highest among Fukushima residents at 9,322, but there are high counts in plenty of other locations as well. (The last line is “Other.”)
Image credit: Japan Wonder Travel
A “Brief” Note on Radiation
Radiation is a word fraught with connotations of sickness and disaster, and it does not surprise me that media coverage latched onto the events at Daiichi. It is difficult to hear the word nuclear without conjuring mental images of Hiroshima and Chernobyl. Since it is invisible, you can’t even know if you’ve been exposed or what it can do to you, and that uncertainty can be terrifying. On top of that, most people don’t know what levels of exposure are legitimately dangerous versus … not-statistically-significant-in-increasing-cancer-risk.
In James May’s “Our Man in Japan” series,[6] which we watched as soon as it dropped on Amazon Prime last November, he travels to the exclusion zone and makes a show for the camera about the danger he’s experiencing. He brings a dosimeter and reacts emphatically as it displays different readings, saying things like “This is very bad … Jeez, that’s 4.94 … That’s dangerously high. I’m not sure anybody should be here.” (Incidentally, he kept misreading the dosage units on the device.)
For the record, I like James May. I enjoyed watching him on Top Gear, but I found his portrayal of the conditions in Fukushima disingenuous at best and dangerous at worst because his assessment was more sensational than factual, and sensational coverage damages public awareness of basic facts. He describes Fukushima as “the second-worst nuclear accident in history,” which is technically true, but the events at Chernobyl were so severe that they’re not even comparable to Fukushima and Three Mile Island (second and third place, respectively).
Image credit: [7]
As I mentioned in part one of this series, I was doing consulting work for a nuclear energy company as part of my graduate degree when the earthquake hit. Watching the overblown speculation and comparisons between Fukushima and Chernobyl at the time was so aggravating to me that I eventually stopped having conversations on the subject. Instead, I simply pointed people to an incredibly detailed and informative (but heavily-disclaimered) infographic created by the author of webcomic XKCD.
Creator Randall Munroe points out that he had to sacrifice some detail for simplicity in the chart, but this will not be the first time (and probably not the last) that I reference his work on my blog. In this image, you can see comparisons between different levels of radiation exposure, measured in the unit Sieverts, or amount of radiation absorbed by a human. NB: all dosage comparisons I reference below are mentioned in this infographic.
One Sievert of exposure is extreme and will cause radiation sickness, which is why more common, daily doses are measured in things like milli-Sieverts (one-thousandth of a Sievert, abbreviated as mSv) or micro-Sieverts (one-millionth of a Sievert, abbreviated as μSv).
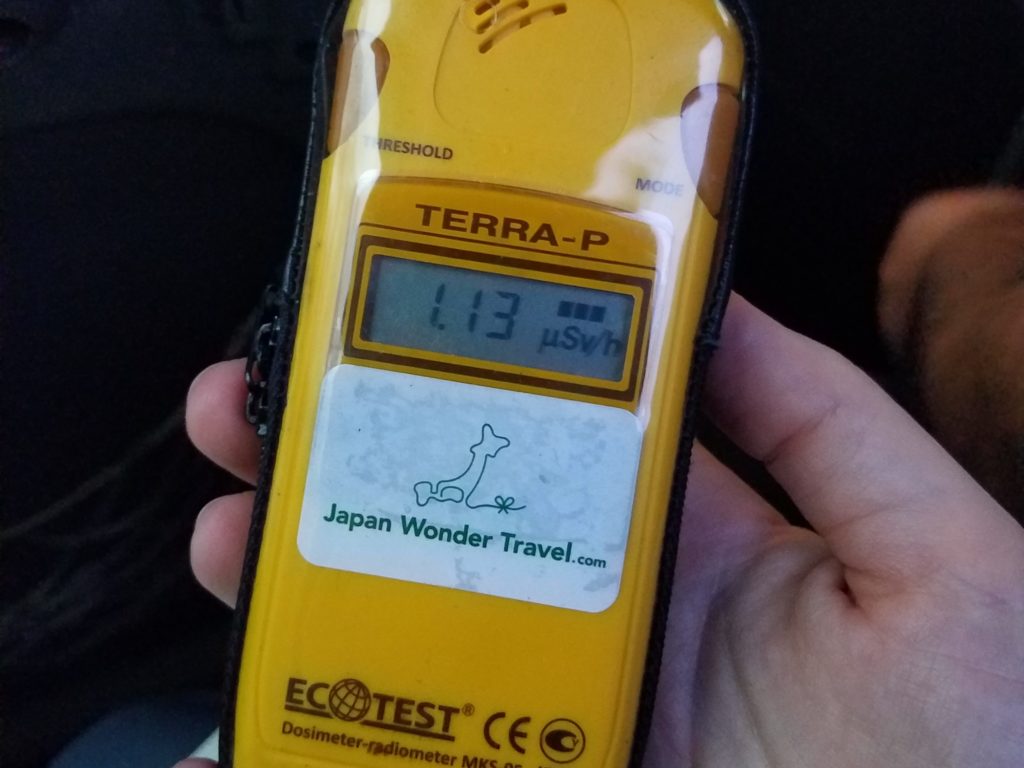
The highest this one registered at any point was just below 2 μSv/hr while we were driving through the “no-go” areas.
While we are speaking of doses, you need to be aware that there is background radiation everywhere. You will always be exposed to some level of radiation anywhere you go on the planet. We get additional exposure on a regular basis from everyday activities, such as eating a banana (0.1 μSv) or living within 50 miles of a coal-fired power plant for a year (0.3 μSv). We get a little more exposure from less-frequent activities, such as taking a cross-country flight (40 μSv) or getting a mammogram (400 μSv). There are incredibly rare activities included in the chart, such as living within 10 miles of Pennsylvania’s Three Mile Island power plant during the nuclear accident there (80 μSv) or living in the Fukushima exclusion zone for the second half of March 2011 (1 mSv).
The chart continues on to list larger doses, including the maximum annual allowed dose for radiation workers in the United States (50 mSv), the lowest one-year dose clearly linked to an increased risk of cancer (100 mSv), a fatal dose of radiation exposure (8 Sv), and finally exposure equal to ten minutes next to the Chernobyl reactor core after meltdown (50 Sv).
My point in calling out all of these numbers is to demonstrate that James May’s “dangerously high” 5 μSv/hour dosimeter readings from his drive through areas that have not yet been remediated are nothing but sensational. If you took a full year of your life to stand on his exact spot, your total exposure would still come out to less than the maximum annual allowable dose for US radiation workers, and less than half the smallest amount of annual radiation exposure that can be definitively tied to cancer.
So we went. We talked to the residents who had returned and to the companies responsible for the ongoing cleanup efforts. Next week we will get into more details about what that cleanup process entails and how long it will take.
Thank you for reading.
[1] https://japanwondertravel.com/
[2] https://www.goodreads.com/book/show/15998107-2-46—aftershocks-stories-from-the-japan-earthquake
[3] https://www.theatlantic.com/technology/archive/2011/04/quakebook-international-sorrow-finds-an-outlet-online/237302/
[4] https://www.theguardian.com/world/blog/2011/apr/14/quakebook-online-story-aid-japan
[5] https://en.wikipedia.org/wiki/2011_T%C5%8Dhoku_earthquake_and_tsunami
[6] https://www.amazon.com/James-May-Our-Japan-Season/dp/B082WM379P
[7] https://blog.xkcd.com/2011/04/26/radiation-chart-update/
0 Comments